Skydive is “an open source real-time network topology and protocols analyzer”. It is a tool (with CLI and web interface) to help analyze and debug your network (OpenStack, OpenShift, containers, …). Dropped packets somewhere? MTU issues? Routing problems? These are some issues where running skydive whill help.
So as an update on my previous demo post (this time based on the Newton release), let’s see how we can trace SFC with this analyzer!
devstack installation
Not a lot of changes here, check out devstack on the stable/newton branch, grab the local.conf file I prepared (configure to use skydive 0.9 release) and run “./stack.sh”!
For the curious, the SFC/Skydive specific parts are:
# SFC
enable_plugin networking-sfc https://git.openstack.org/openstack/networking-sfc stable/newton
# Skydive
enable_plugin skydive https://github.com/skydive-project/skydive.git refs/tags/v0.9.0
enable_service skydive-agent skydive-analyzer
Skydive web interface and demo instances
Before running the script to configure the SFC demo instances, open the skydive web interface (it listens on port 8082, check your instance firewall if you cannot connect):
http://${your_devstack_ip}:8082
The login was configured with devstack, so if you did not change, use admin/pass123456.
Then add the demo instances as in the previous demo:
$ git clone https://github.com/voyageur/openstack-scripts.git -b sfc_newton_demo
$ ./openstack-scripts/simple_sfc_vms.sh
And watch as your cloud goes from “empty” to “more crowded”:
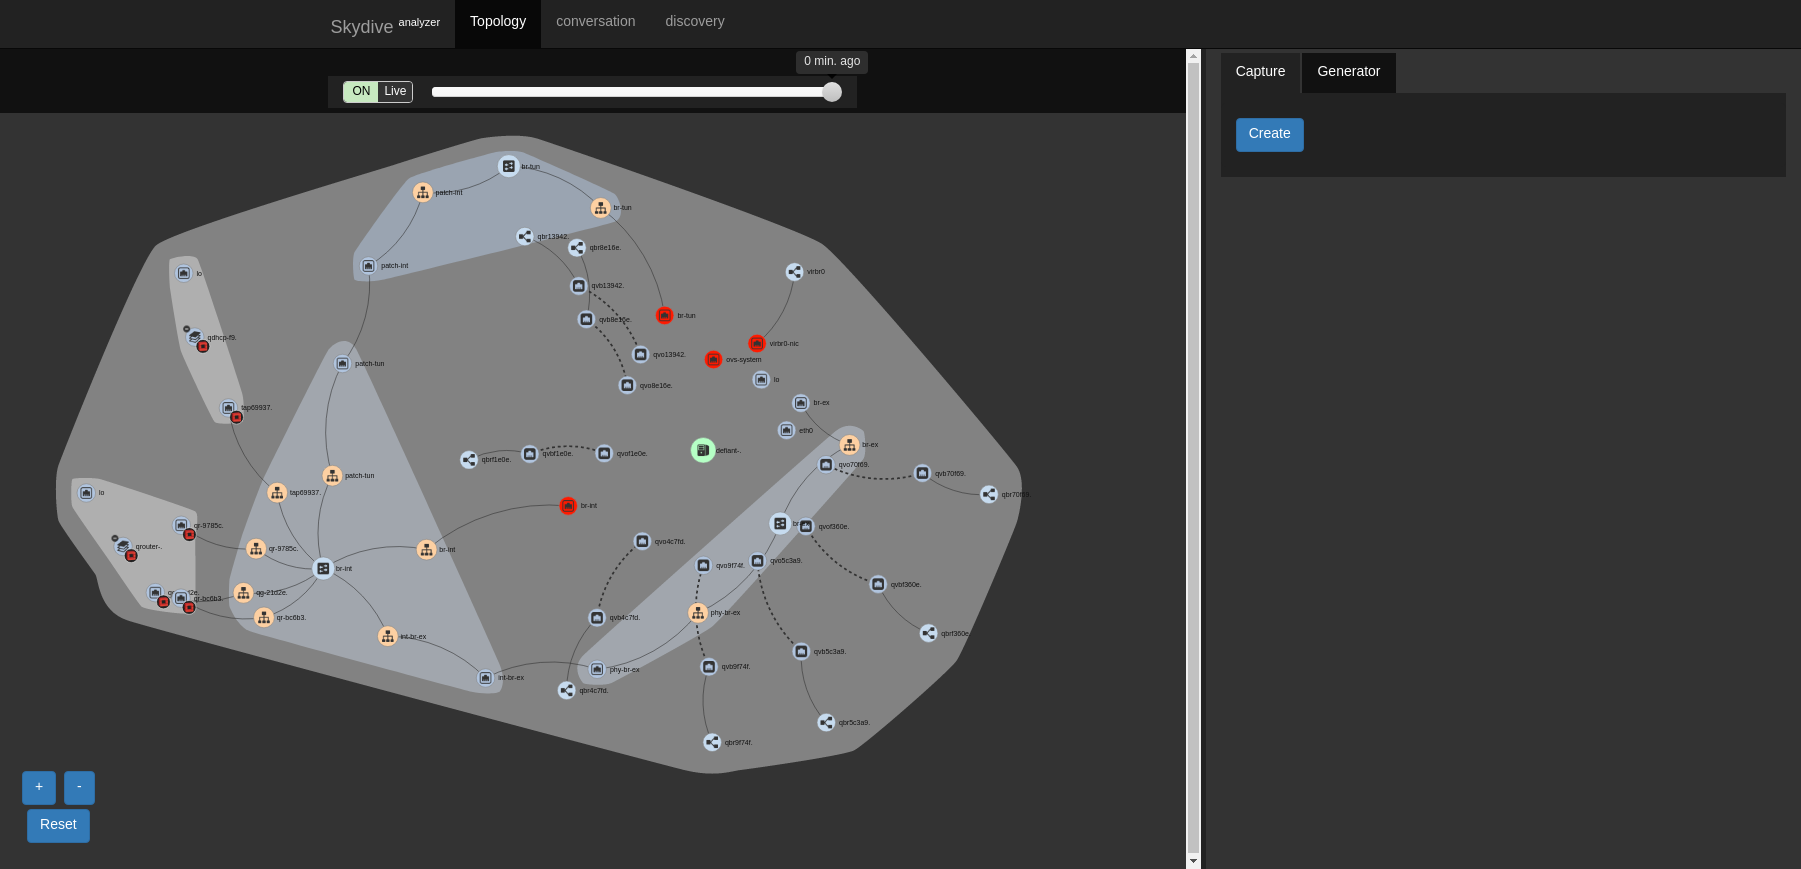 |
 |
Skydive CLI, start traffic capture
Now let’s enable traffic capture on the integration bridge (br-int), and all tap interfaces (more details on the skydive CLI available in the documentation):
$ export SKYDIVE_USERNAME=admin
$ export SKYDIVE_PASSWORD=pass123456
$ /opt/stack/go/bin/skydive --conf /tmp/skydive.yaml client capture create --gremlin "G.V().Has('Name', 'br-int', 'Type', 'ovsbridge')"
$ /opt/stack/go/bin/skydive --conf /tmp/skydive.yaml client capture create --gremlin "G.V().Has('Name', Regex('^tap.*'))"
Note this can be done in the web interface too, but I wanted to show both interfaces.
Track a HTTP request diverted by SFC
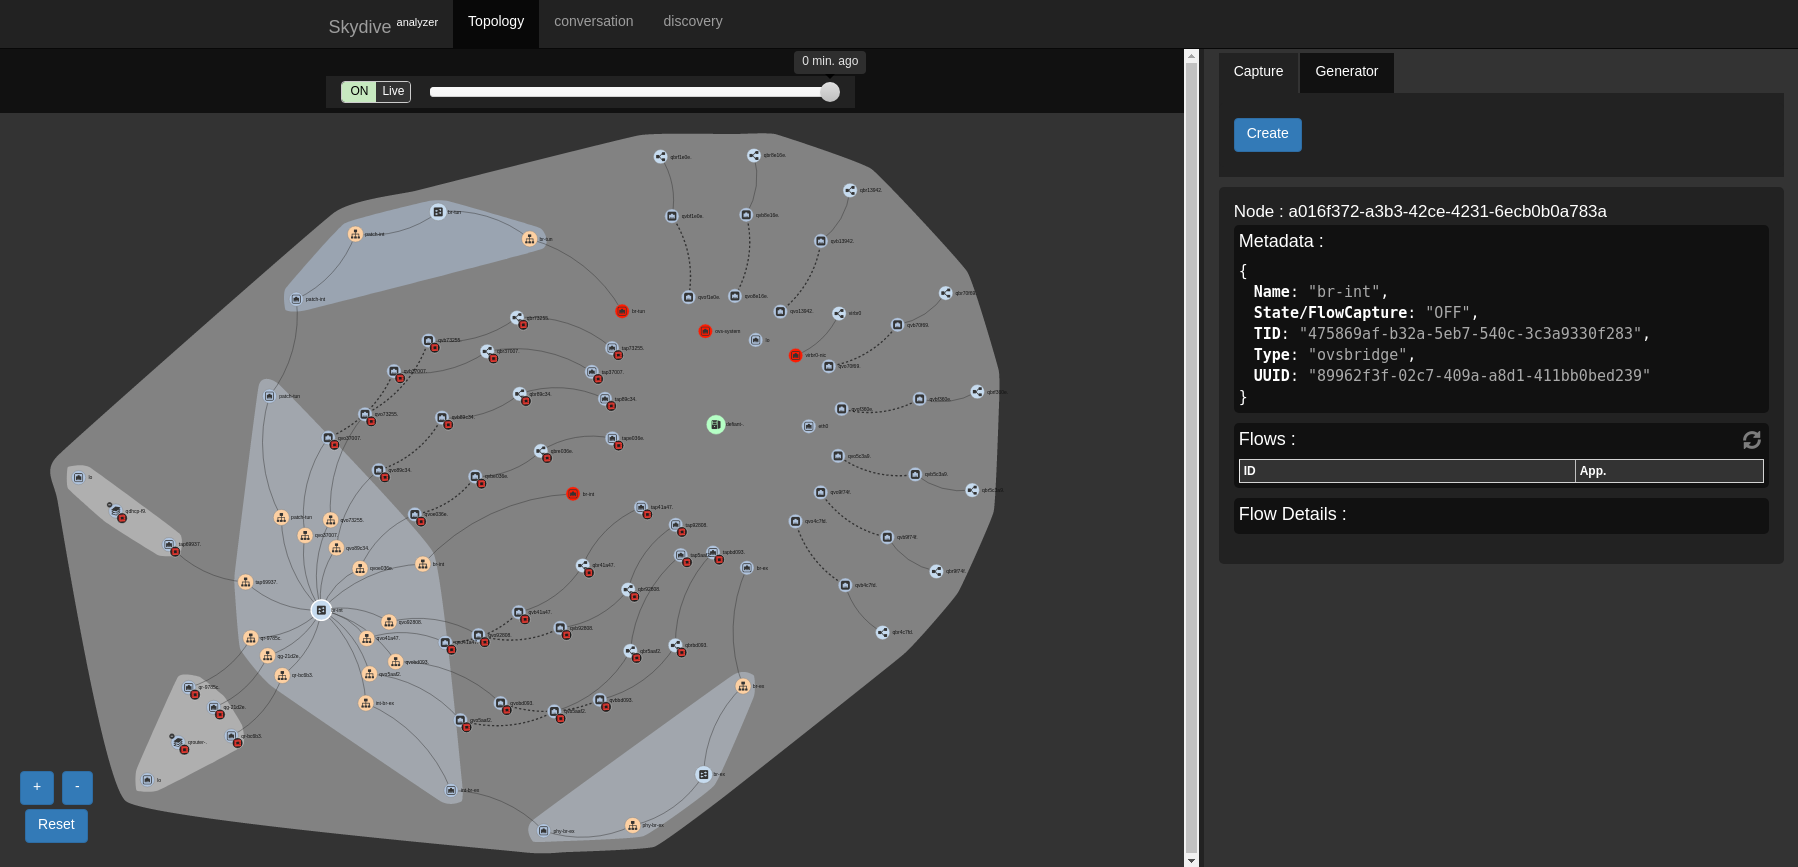
Make a HTTP request from the source VM to the destination VM (see previous post for details). We will highlight the nodes where this request has been captured: in the GUI, click on the capture create button, select “Gremlin expression”, and use the query:
G.Flows().Has('Network','10.0.0.18','Transport','80').Nodes()
This expression reads as “on all captured flows matching IP address 10.0.0.18 and port 80, show nodes”. With the CLI you would get a nice JSON output of these nodes, here in the GUI these nodes will turn yellow:

If you look at our tap interface nodes, you will see that two are not highlighted. If you check their IDs, you will find that they belong to the same service VM, the one in group 1 that did not get the traffic.
If you want to single out a request, in the skydive GUI, select one node where capture is active (for example br-int). In the flows table, select the request, scroll down to get its layer 3 tracking ID “L3TrackingID” and use it as Gremlin expression:
G.Flows().Has('L3TrackingID','5a7e4bd292e0ba60385a9cafb22cf37d744a6b46').Nodes()
Going further
Now it’s your time to experiment! Modify the port chain, send a new HTTP request, get its L3TrackingID, and see its new path. I find the latest ID quickly with this CLI command (we will see how the skydive experts will react to this):
$ /opt/stack/go/bin/skydive --conf /tmp/skydive.yaml client topology query --gremlin "G.Flows().Has('Network','10.0.0.18','Transport','80').Limit(1)" | jq ".[0].L3TrackingID"
You can also check each flow in turn, following the paths from a VM to another one, go further with SFC, or learn more about skydive:
- Project site: https://github.com/skydive-project/skydive
- Documentation: https://skydive-project.github.io/skydive/
- Another blog post on devstack deployment: https://blogs.rdoproject.org/7921/skydive-plugin-for-devstack
- The YouTube channel with some demo videos
Hi, this is really useful for my thesis about sfc over openstack, but i can not find the local.conf you have prepared, may you tell me where is it?
Thanks for all, good job!!
Oops, indeed the link is missing! Here it is (I updated the blog entry too):
https://github.com/voyageur/devstack-configs/blob/ddfe8d04b7ed34143e1df6eff54b8dfbc5b5ae20/local.conf.sfc%2Bskydive.newton
(sorry for the delay, I was away for a few days)
It is really necessary to put enable_service neutron? Is not enabled by default on devstack once you run stack.sh?
Thanks, much appreciated!
Probably not needed since some versions 🙂 This is by no means a “minimal” file, I tend to add stuff to easily test setups/disable things (and also support old openstack versions).
Just adding the specific parts listed on a default local.conf will work too
I see, last version has it enabled by default.
I´m having some problems after install SFC, I´m trying this diagram to test it
eth0 eth0 eth0
Source——-Firewall———Destination
| / \ |
eth1 ………. eth1 ……… eth2…………….. eth1
Where – line means a normal ping without SFC and . line means the same with SFC
I have enabled eth1 and eth2 with their correspondet ips and added the routes as you can see in the image above, but the packets still go through the – path. What could be the problem?
Do i have to delete in the route table the – path?
Thanks! I´m really enjoying this.
If I got it correctly, both source and dest systems have 2 interfaces: on eth0 traffic should go directly to eth0 on dest, on eth1 it should go through the firewall (with SFC help) and end on dest eth1?
If both interfaces are in the same network, all the traffic from the source vm will leave on one interface yes probably (eth0 in this case).
It is probably easier with separate networks. Though if it is to showcase SFC in action, you can also make a simpler case (one interface on source/dest), and create/delete the port chain: traffic that was going straight will go through the firewall after adding the chain, and returning to short path after removing it.
Of course, all of this if I got it correctly 🙂
Hi there,
I`ve tried the scenario you said (source-function-destination) but once i do the rule for http packets, my packets got stuck into the function machine (it does not do forwarding between ifaces even tho it is enabled). Im running the function with a simple cirros image with almost no commands. Can´t figure out where is the problem
Problem solved, I found that since kilo there is a flag named port_security which does not allow to do spoofing (required for ip forwarding), so disabling it I could ran everything as expected
Thanks!
Glad you quickly found the solution! That is something I do in my demo script:
https://github.com/voyageur/openstack-scripts/blob/19bf3ae7996ba1df20b35cad81a66f2e65044467/simple_sfc_vms.sh#L9
But I did not mention it explicitly in the post, sorry.
Yeah, did not realize of that lane to made my own scripts.
Do you know why in the first group composed by VM1 and VM2 the packets always go through the same machine even tho both VMs are up?
I don’t remember testing it, but in the OVS driver it mostly uses the default behaviour (with type=select). This should be based on the source IP/MAC address. So with a single source VM, you will indeed see all traffic go through the same service VM in the group