Installing networking-sfc RPM in a TripleO setup

After a short detour on how Skydive can help debugging Service Function Chaining, in this post I will give details on the new RPM files now available in RDO to install networking-sfc. We will go through a complete TripleO demo deployment, and configure the different nodes to enable networking-sfc components.
Note that most steps will be quite generic, so can be used to install networking-sfc on other OpenStack setups!

Running tripleo-quickstart

To quickly get a TripleO setup up and running, I used tripleo-quickstart with most default options. So prepare a big enough machine (I used a 32GB one), that you can SSH in as root with password, get this helpful script and run it on master “release”:
$ ./quickstart.sh --install-deps
$ ./quickstart.sh -R master -t all ${VIRTHOST}

After some coffee cups, you should get an undercloud node, an overcloud with one compute node and one controller node, all running inside your test system.

Accessing the nodes

A quick tip here: if you want to have an easy access to all nodes and web interfaces, I recommend sshuttle, the “poor man’s VPN”. Once installed (it is available in Fedora and Gentoo at least), run this command (as root):
# sshuttle -e "ssh -F /home/YOUR_USER/.quickstart/ssh.config.ansible" -r undercloud -v 10.0.0.0/24 192.168.24.0/24

And now, you can directly access both undercloud IP addresses (192.168.x.x) and overcloud ones (10.x)! For example, you can take a look at the tripleo-ui web interface, which should be at http://192.168.24.1:3000/ (username:admin, password: find with “sudo hiera admin_password” on the undercloud)

As for SSH access, tripleo-quickstart created a configuration file to simplify the commands, so you can use these:
# undercloud login (where we can run CLI commands)
$ ssh -F ~/.quickstart/ssh.config.ansible undercloud
# overcloud compute node
$ ssh -F ~/.quickstart/ssh.config.ansible overcloud-novacompute-0
# overcloud controller node
$ ssh -F ~/.quickstart/ssh.config.ansible overcloud-controller-0

The undercloud has some interesting scripts and credential files (stackrc for the undercloud itself, overcloudrc for… the overcloud indeed). But let’s go back to SFC before.

Enable networking-sfc

First, install the networking-sfc RPM package on each node (we will run CLI and demo scripts from the undercloud, so do it on all three nodes):
# yum install -y python-networking-sfc

That was easy, right? OK, you still have to do the configuration steps manually (for now).

On the controller node(s), modify the neutron-server configuration file /etc/neutron/neutron.ini:

# Look for service_plugins line, add the SFC ones at the end
# The service plugins Neutron will use (list value)
service_plugins=router,qos,trunk,networking_sfc.services.flowclassifier.plugin.FlowClassifierPlugin,networking_sfc.services.sfc.plugin.SfcPlugin
[...]
# At the end, set the backends to use (in this case, the default OVS one)
[sfc]
drivers = ovs

[flowclassifier]
drivers = ovs

The controller is now configured. Now, create the SFC tables in the neutron database, and restart the neutron-server service:
$ sudo neutron-db-manage --subproject networking-sfc upgrade head
$ sudo systemctl restart neutron-server

Now for the compute node(s)! We will enable the SFC extension in the Open vSwitch agent, note that its configuration file can be different depending on your setup (you can confirm yours checking the output of “ps aux|grep agent”). In this demo, edit /etc/neutron/plugins/ml2/openvswitch_agent.ini

# This time, look for the extensions line, add sfc to it
# Extensions list to use (list value)
extensions =qos,sfc

And restart the agent:
$ sudo systemctl restart neutron-openvswitch-agent

Demo time

Congratulations, you successfully deployed a complete OpenStack setup and enabled SFC on it! To confirm it, connect to the undercloud and run some networking-sfc commands against the overcloud, they should run without errors:
$ source overcloudrc
(OVERCLOUD) $ neutron port-pair-list # Or "port-pair-create --help"

I updated my demo script for this tripleo-quickstart setup: in addition to the SFC-specific parts, it will also create basic networks, images, … and floating IP addresses for the demo VMs (we can not connect directly to the private addresses as we are not on the same node this time). Now, still on the undercloud, download an run the script:
$ git clone https://github.com/voyageur/openstack-scripts.git
$ ./openstack-scripts/simple_sfc_vms.sh

If all went well, you can read back a previous post to see how to test this setup, or go on your own and experiemnt.

As a short example to end this post, this will confirm that an HTTP request from the source VM does indeed visit a few systems on the way:
$ source overcloudrc
# Get the private IP for the destination VM
(OVERCLOUD) $ openstack server show -f value -c addresses dest_vm
private=172.24.4.9, 192.168.24.104
# Get the floating IP for the source VM
(OVERCLOUD) $ openstack server show -f value -c addresses source_vm
private=172.24.4.19, 192.168.24.107
(OVERCLOUD) $ ssh cirros@192.168.24.107

$ traceroute -n 172.24.4.9
traceroute to 172.24.4.9 (172.24.4.9), 30 hops max, 46 byte packets
1 172.24.4.13 23.700 ms 0.476 ms 0.320 ms
2 172.24.4.15 4.239 ms 0.467 ms 0.374 ms
3 172.24.4.9 0.941 ms 0.599 ms 0.429 ms

Yes, these networking-sfc RPM packages do seem to work 🙂
Tracking Service Function Chaining with Skydive

Skydive is “an open source real-time network topology and protocols analyzer”. It is a tool (with CLI and web interface) to help analyze and debug your network (OpenStack, OpenShift, containers, …). Dropped packets somewhere? MTU issues? Routing problems? These are some issues where running skydive whill help.

So as an update on my previous demo post (this time based on the Newton release), let’s see how we can trace SFC  with this analyzer!

devstack installation

Not a lot of changes here, check out devstack on the stable/newton branch, grab the local.conf file I prepared (configure to use skydive 0.9 release) and run “./stack.sh”!

For the curious, the SFC/Skydive specific parts are:
# SFC
enable_plugin networking-sfc https://git.openstack.org/openstack/networking-sfc stable/newton

# Skydive
enable_plugin skydive https://github.com/skydive-project/skydive.git refs/tags/v0.9.0
enable_service skydive-agent skydive-analyzer

Skydive web interface and demo instances

Before running the script to configure the SFC demo instances, open the skydive web interface (it listens on port 8082, check your instance firewall if you cannot connect):

http://${your_devstack_ip}:8082

The login was configured with devstack, so if you did not change, use admin/pass123456.
Then add the demo instances as in the previous demo:
$ git clone https://github.com/voyageur/openstack-scripts.git -b sfc_newton_demo
$ ./openstack-scripts/simple_sfc_vms.sh

And watch as your cloud goes from “empty” to “more crowded”:

Skydive CLI, start traffic capture

Now let’s enable traffic capture on the integration bridge (br-int), and all tap interfaces (more details on the skydive CLI available in the documentation):
$ export SKYDIVE_USERNAME=admin
$ export SKYDIVE_PASSWORD=pass123456
$ /opt/stack/go/bin/skydive --conf /tmp/skydive.yaml client capture create --gremlin "G.V().Has('Name', 'br-int', 'Type', 'ovsbridge')"
$ /opt/stack/go/bin/skydive --conf /tmp/skydive.yaml client capture create --gremlin "G.V().Has('Name', Regex('^tap.*'))"

Note this can be done in the web interface too, but I wanted to show both interfaces.

Track a HTTP request diverted by SFC

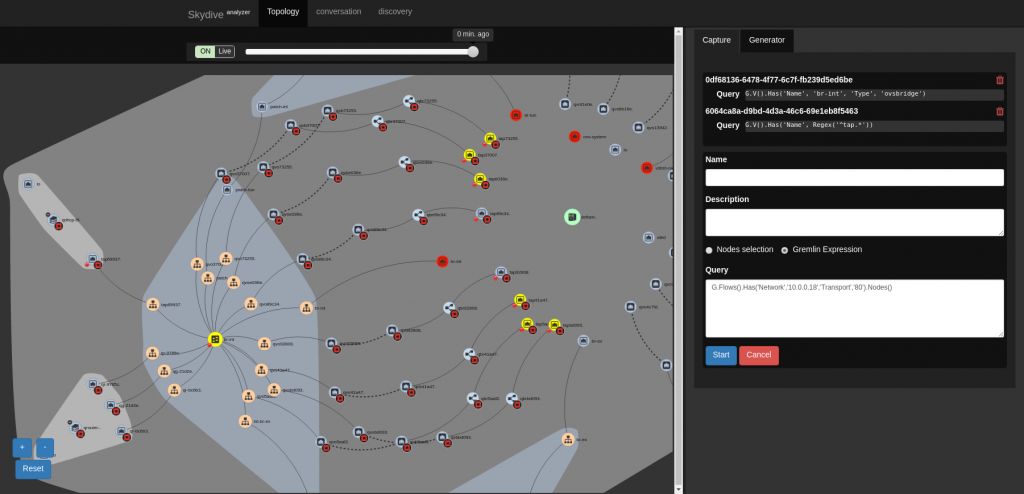
Make a HTTP request from the source VM to the destination VM (see previous post for details). We will highlight the nodes where this request has been captured: in the GUI, click on the capture create button, select “Gremlin expression”, and use the query:
G.Flows().Has('Network','10.0.0.18','Transport','80').Nodes()

This expression reads as “on all captured flows matching IP address 10.0.0.18 and port 80, show nodes”. With the CLI you would get a nice JSON output of these nodes, here in the GUI these nodes will turn yellow:

If you look at our tap interface nodes, you will see that two are not highlighted. If you check their IDs, you will find that they belong to the same service VM, the one in group 1 that did not get the traffic.

If you want to single out a request, in the skydive GUI, select one node where capture is active (for example br-int). In the flows table, select the request, scroll down to get its layer 3 tracking ID “L3TrackingID” and use it as Gremlin expression:
G.Flows().Has('L3TrackingID','5a7e4bd292e0ba60385a9cafb22cf37d744a6b46').Nodes()

Going further

Now it’s your time to experiment! Modify the port chain, send a new HTTP request, get its L3TrackingID, and see its new path. I find the latest ID quickly with this CLI command (we will see how the skydive experts will react to this):
$ /opt/stack/go/bin/skydive --conf /tmp/skydive.yaml client topology query --gremlin "G.Flows().Has('Network','10.0.0.18','Transport','80').Limit(1)" | jq ".[0].L3TrackingID"

You can also check each flow in turn, following the paths from a VM to another one, go further with SFC, or learn more about skydive:

Local testing of OpenStack Grafana dashboard changes

2021 update

Since this article still gets some views, I wanted to highlight a new method to run Grafana locally as a podman container. The steps are detailed in the official documentation for system-config and are easier/faster than this legacy method.

Now for the curious people, here is how I did it a few years ago:

Original article

OpenStack has a Grafana dashboard with infrastructure metrics, including CI jobs history (failure rate, …). These dashboards are configured via YML files, hosted in the project-config repo, with the help of grafyaml.

As a part of the Neutron stadium, projects like networking-sfc are expected to have a working grafana dashboard for failure rates in gates. I updated the configuration file for networking-sfc recently, but wanted to locally test these changes before sending them for review.

Documentation mentions the steps with the help of puppet, but I wanted to try and configure a local test server. Here are my notes on the process!

Installing the Grafana server

I run this on a Centos 7 VM, with some of the usual development packages already installed (git, gcc, python, pip, …). Some steps will be distribution-specific, like grafana install here.

Follow Grafana install documentation,  by creating the repository file /etc/yum.repos.d/grafana.repo with the following content:

[grafana]
name=grafana
baseurl=https://packages.grafana.com/oss/rpm
repo_gpgcheck=1
enabled=1
gpgcheck=1
gpgkey=https://packages.grafana.com/gpg.key
sslverify=1
sslcacert=/etc/pki/tls/certs/ca-bundle.crt

And then install the package
[root@grafana ~]# yum install grafana

Then start the server:
[root@grafana ~]# systemctl start grafana-server
(optionally, run “systemctl enable grafana-server” if you want it to start at boot)
And check that you can connect to http://${SERVER_IP}:3000, the default login password is admin / admin

Install and configure grafyaml

Seeing the main dashboard? Good, now open the API keys menu, and generate a key with Admin role (required as we will change the data source).

Now install grafyaml via pip (some distributions have a package for it, but not Centos):
[root@grafana ~]# pip install grafyaml

Create the configuration file /etc/grafyaml/grafyaml.conf with the following content (use the API key you just generated):

[grafana]
url = http://localhost:3000
apikey = generated_admin_key

Configure a dashboard

Now get the current configuration for OpenStack dashboards, and add one of them:
[root@grafana ~]# git clone https://git.openstack.org/openstack-infra/project-config # or sync from your local copy
[root@grafana ~]# grafana-dashboard update project-config/grafana/datasource.yaml
[root@grafana ~]# grafana-dashboard update project-config/grafana/networking-sfc.yaml

The first update command will add the OpenStack graphite datasource, the second one adds the current networking-sfc dashboard (the one I wanted to update in this case).
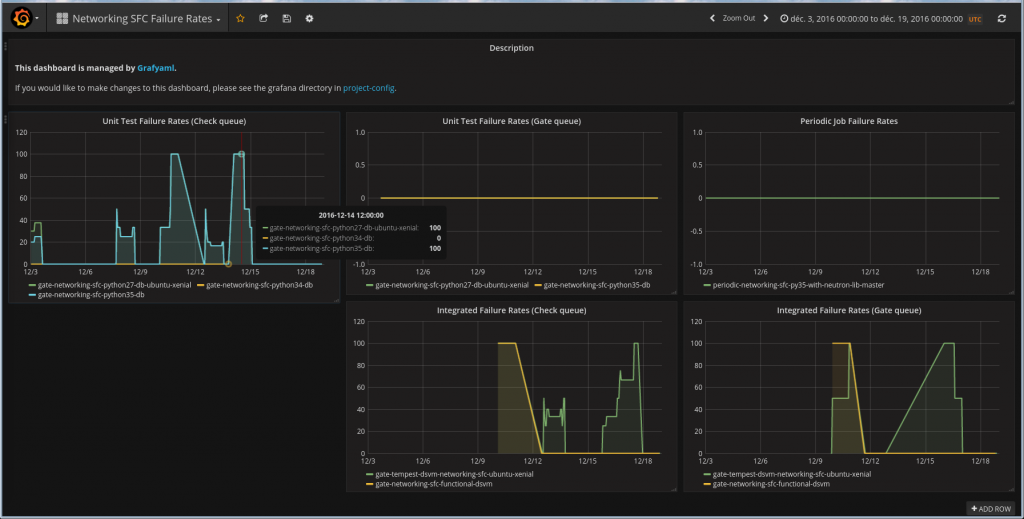
If everything went fine, refresh the grafana page, you should be able to select the Networking SFC Failure rates dashboard and see the same graphs as on the main site.

Modifying the dashboard

But we did not set up this system just to mimick the existing dashboards, right? Now it’s time to add your modifications to the dashboard YAML file, and test them.

A small tip on metrics names: if you want to be sure “stats_counts.zuul.pipeline.check.job.gate-networking-sfc-python27-db-ubuntu-xenial.FAILURE” is a correct metric, http://graphite.openstack.org is your friend!
This is a web interface to the datasource, and allows you to look for metrics by exact name (Search), with some auto-completion help (Auto-completer), or browsing a full tree (Tree).

Now that you have your metrics, update the YAML file with new entries, then you can validate (the YAML structure only, for metrics names see previous paragraph) and update your grafana dashboard with:
[root@grafana ~]# grafana-dashboard validate project-config/grafana/networking-sfc.yaml
[root@grafana ~]# grafana-dashboard update project-config/grafana/networking-sfc.yaml

Refresh your browser and you can see how your modifications worked out!

Next steps

Remember that this is a simple local test setup (default account, api key with admin privileges, manual configuration, …). This can be used as a base guide for a real grafana/grafyaml server, but the next steps are left as an exercise for the reader!

In the meantime, I found it useful to be able to try and visualize my changes before sending the patch for review.

Service Function Chaining demo with devstack

After a first high-level post, it is time to actually show networking-sfc in action! Based on a documentation example, we will create a simple demo, where we route some HTTP traffic through some VMs, and check the packets on them with tcpdump:

SFC demo diagram

This will be hosted on a single node devstack installation, and all VMs will use the small footprint CirrOS image, so this should run on “small” setups.

Installing the devstack environment

On your demo system (I used Centos 7), check out devstack on the Mitaka branch (remember to run devstack as a sudo-capable user, not root):

[stack@demo ~]$ git clone https://git.openstack.org/openstack-dev/devstack -b stable/mitaka

Grab my local configuration file that enables the networking-sfc plugin, rename it to local.conf in your devstack/ directory.
If you prefer to adapt your current configuration file, just make sure your devstack checkout is on the mitaka branch, and add the SFC parts:
# SFC
enable_plugin networking-sfc https://git.openstack.org/openstack/networking-sfc
SFC_UPDATE_OVS=False

Then run the usual “./stack.sh” command, and go grab a coffee.

Deploy the demo instances

To speed this step up, I regrouped all the following items in a script. You can check it out (at a tested revision for this demo):
[stack@demo ~]$ git clone https://github.com/voyageur/openstack-scripts.git -b sfc_mitaka_demo

The script simple_sfc_vms.sh will:

  • Configure security (disable port security, set a few things in security groups, create a SSH key pair)
  • Create source, destination systems (with a basic web server)
  • Create service VMs, configuring the network interfaces and static IP routing to forward the packets
  • Create the SFC items (port pair, port pair  group, flow classifier, port chain)

I highly recommend to read it, it is mostly straightforward and commented, and where most of the interesting commands are hidden. So have a look, before running it:
[stack@demo ~]$ ./openstack-scripts/simple_sfc_vms.sh
WARNING: setting legacy OS_TENANT_NAME to support cli tools.
Updated network: private
Created a new port:
[...]

route: SIOCADDRT: File exists
WARN: failed: route add -net "0.0.0.0/0" gw "192.168.0.1"
You can safely ignore the route errors at the end of the script (they are caused by duplicate default route on the service VMs).

Remember, from now on, to source the credentials file in your current shell before running CLI commands:
[stack@demo ~]$ source ~/devstack/openrc demo demo

We first get the IP addresses for our source and destination demo VMs:[stack@demo ~]$ openstack server show source_vm -f value -c addresses; openstack server show dest_vm -f value -c addresses

private=fd73:381c:4fa2:0:f816:3eff:fe96:de8f, 10.0.0.9
private=10.0.0.10, fd73:381c:4fa2:0:f816:3eff:fe65:12fd

Now, we look for the tap devices associated to our service VMs:
[stack@demo ~]$ neutron port-list -f table -c id -c name

+----------------+--------------------------------------+
| name           | id                                   |
+----------------+--------------------------------------+
| p1in           | 897df85a-26c3-4491-888e-8cc58f19cea1 |
| p1out          | fa838294-317d-46df-b10e-b1734dd62faf |
| p2in           | c86dafc7-bda6-4537-b806-be2282f7e11e |
| p2out          | 12e58ea8-a9ab-4d0b-9fd7-707dc6e99f20 |
| p3in           | ee14f406-e9d6-4047-812b-aa04514f50dd |
| p3out          | 2d86403b-4639-40a0-897e-68fa0c759f01 |
[...]

These devices names follow the tap<port ID first 10 digits> pattern, so for example tap897df85a-26 is the associated  for the p1in port here

See SFC in action

In this example we run a request loop from client_vm to dest_vm (remember to use the IP addresses found in the previous section):
[stack@demo ~]$ ssh cirros@10.0.0.9
$ while true; do curl 10.0.0.10; sleep 1; done
Welcome to dest-vm
Welcome to dest-vm
Welcome to dest-vm
[...]

So we do have access to the web server! But does the packets really go through the service VMs? To confirm that, in another shell, run tcpdump on the tap interfaces:

# On the outgoing interface of VM 3
$ sudo tcpdump port 80 -i tap2d86403b-46
tcpdump: WARNING: tap2d86403b-46: no IPv4 address assigned
tcpdump: verbose output suppressed, use -v or -vv for full protocol decode
listening on tap2d86403b-46, link-type EN10MB (Ethernet), capture size 65535 bytes
11:43:20.806571 IP 10.0.0.9.50238 > 10.0.0.10.http: Flags [S], seq 2951844356, win 14100, options [mss 1410,sackOK,TS val 5010056 ecr 0,nop,wscale 2], length 0
11:43:20.809472 IP 10.0.0.9.50238 > 10.0.0.10.http: Flags [.], ack 3583226889, win 3525, options [nop,nop,TS val 5010057 ecr 5008744], length 0
11:43:20.809788 IP 10.0.0.9.50238 > 10.0.0.10.http: Flags [P.], seq 0:136, ack 1, win 3525, options [nop,nop,TS val 5010057 ecr 5008744], length 136
11:43:20.812226 IP 10.0.0.9.50238 > 10.0.0.10.http: Flags [.], ack 39, win 3525, options [nop,nop,TS val 5010057 ecr 5008744], length 0
11:43:20.817599 IP 10.0.0.9.50238 > 10.0.0.10.http: Flags [F.], seq 136, ack 40, win 3525, options [nop,nop,TS val 5010059 ecr 5008746], length 0
[...]

Here are some other examples (skipping the tcpdump output for clarity):
# You can check other tap devices, confirming both VM 1 and VM2 get traffic
$ sudo tcpdump port 80 -i tapfa838294-31
$ sudo tcpdump port 80 -i tap12e58ea8-a9

# Now we remove the flow classifier, and check the tcpdump output
$ neutron port-chain-update --no-flow-classifier PC1
$ sudo tcpdump port 80 -i tap2d86403b-46 # Quiet time

# We restore the classifier, but remove the group for VM3, so tcpdump will only show traffic on other VMs
$ neutron port-chain-update --flow-classifier FC_demo --port-pair-group PG1 PC1
$ sudo tcpdump port 80 -i tap2d86403b-46 # No traffic
$ sudo tcpdump port 80 -i tapfa838294-31 # Packets!

# Now we remove VM1 from the first group
$ neutron port-pair-group-update PG1 --port-pair PP2
$ sudo tcpdump port 80 -i tapfa838294-31 # No more traffic
$ sudo tcpdump port 80 -i tap12e58ea8-a9 # Here it is

# Restore the chain to its initial demo status
$ neutron port-pair-group-update PG1 --port-pair PP1 --port-pair PP2
$ neutron port-chain-update --flow-classifier FC_demo --port-pair-group PG1 --port-pair-group PG2 PC1

Where to go from here

Between these examples, the commands used in the demo script, and the documentation, you should have enough material to try your own commands! So have fun experimenting with these VMs.

Note that in the meantime we released the Newton version (3.0.0), which also includes the initial OpenStackClient (OSC) interface, so I will probably update this to run on Newton and with some shiny “openstack sfc xxx” commands. I also hope to make a nicer-than-tcpdumping-around demo later on, when time permits.

What is “Service Function Chaining”?

This is the first article in a series about Service Function Chaining (SFC for short), and its OpenStack implementation, networking-sfc, that I have been working on.

The SFC acronym can easily appear in Software-defined networking (SDN), in a paper about Network function virtualization (NFV), in some IETF documents, … Some of these broader subjects use other names for SFC elements, but this is probably a good topic for another post/blog.
If you already know SFC elements, you can probably skip to the next blog post.

Definitions

So what is this “Service Function Chaining”? Let me quote the architecture RFC:

The delivery of end-to-end services often requires various service functions. These include traditional network service functions such
as firewalls and traditional IP Network Address Translators (NATs),
as well as application-specific functions. The definition and instantiation of an ordered set of service functions and subsequent
“steering” of traffic through them is termed Service Function
Chaining (SFC).

I see SFC as a higher level of abstraction routing: in a typical network, you route all the traffic coming from Internet through a firewall box. So you set up the firewall system, with its network interfaces (Internet and intranet sides), and add some IP routes to steer the traffic through.
SFC uses the same concept, but with logical blocks: if a packet matches some conditions (it is Internet traffic), force it through a series of “functions” (in that case, only one function: a firewall system). And voilà, you have your Service function chain!

I like this simple comparison as it introduces most of the SFC elements:

  • service function: a.k.a. “bump in the wire”. This is a transparent system that you want some flows to go through (typical use cases: firewall, load balancer, analyzer).
  • flow classifier: the “entry point”, it determines if a flow should go through the chain. This can be based on IP attributes (source/dest adress/port, …), layer 7 attributes or even from metadata in the flow, set by a previous chain.
  • port pair:  as the name implies, this is a pair of ports (network interfaces) for a service function (the firewall in our example). The traffic is routed to the “in” port, and is expected to exit the VM through the “out” port. This can be the same port
  • port chain: the SFC object itself, a set of flow classifiers and a set of port pairs (that define the chain sequence).

An additional type not mentioned before is the port pair group: if you have multiple service functions of an identical type, you can regroup them to distribute the flows among them.

Use cases and advantages

OK, after seeing all these definitions, you may wonder “what’s the point?” What I have seen so far is that it allows:

  • complex routing made easier. Define a sequence of logical steps, and the flow will go through it.
  • HA deployments: add multiple VMS in a same group, and the load will be distributed between them.
  • dynamic inventory. Add or remove functions dynamically, either to scale a group (add a load balancer, remove an analyzer), change functions order, add a new function in the middle of some chain, …
  • complex classification. Flows can be classified based on L7 criterias, output from a previous chain (for example a Deep-Packet Inspection system).

Going beyond these technical advantages, you can read an RFC that is actually a direct answer to this question: RFC 7498

Going further

To keep a reasonable post length, I did not talk about:

  • How does networking-sfc tag traffic? Hint: MPLS labels
  • Service functions may or may not be SFC-aware: proxies can handle the SFC tagging
  • Upcoming feature: support for Network Service Header (NSH)
  • Upcoming feature: SFC graphs (allowing complex chains and chains of chains)
  • networking-sfc modularity: reference implementation uses OVS, but this is juste one of the possible drivers
  • Also, networking-sfc architecture in general
  • SFC use in VNF Forwarding Graphs (VNFFG)

Links

SFC has abundant documentation, both in the OpenStack project and outside. Here is some additional reading if you are interested (mostly networking-sfc focused):

New job and new blog category

Sorry blog, this announcement comes late for you (I updated sites like Linkedin some time ago), but better late than never!

I got myself a new job in May, joining the Red Hat software developers working on OpenStack. More specifically, I will work mostly on the network parts: Neutron itself (the “networking as a service” main project), but also other related projects like Octavia (load balancer), image building, and more recently Service Function Chaining.

Working upstream on these projects, I plan to write some posts about them, which will be regrouped in a new OpenStack category. I am not sure yet about the format (short popularisation items and tutorials, long advanced technical topics, a mix of both, …), we will see. In all cases, I hope it will be of interest to some people 🙂

PS for Gentoo Universe readers: don’t worry, that does not mean I will switch all my Linux boxes to RHEL/CentOS/Fedora! I still have enough free time to work on Gentoo