2021 update
Since this article still gets some views, I wanted to highlight a new method to run Grafana locally as a podman container. The steps are detailed in the official documentation for system-config and are easier/faster than this legacy method.
Now for the curious people, here is how I did it a few years ago:
Original article
OpenStack has a Grafana dashboard with infrastructure metrics, including CI jobs history (failure rate, …). These dashboards are configured via YML files, hosted in the project-config repo, with the help of grafyaml.
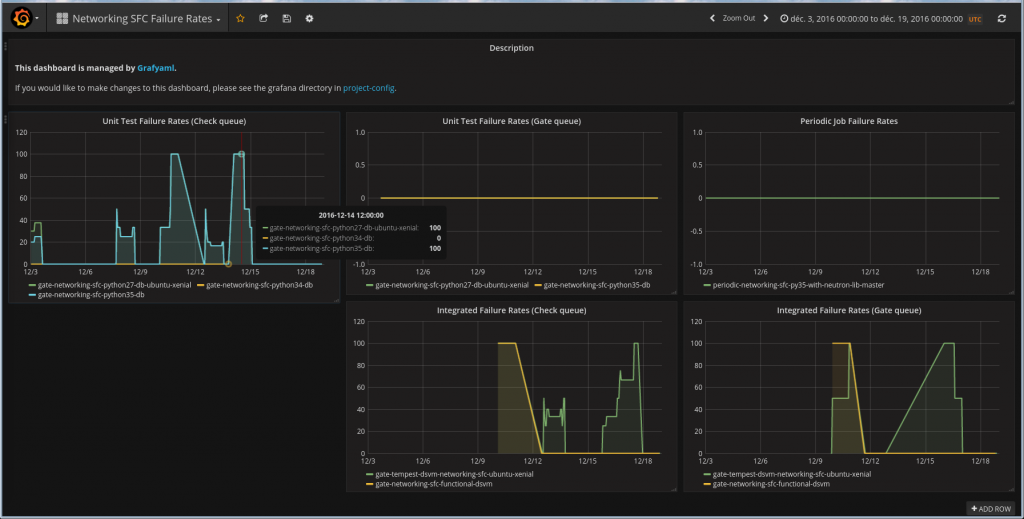
As a part of the Neutron stadium, projects like networking-sfc are expected to have a working grafana dashboard for failure rates in gates. I updated the configuration file for networking-sfc recently, but wanted to locally test these changes before sending them for review.
Documentation mentions the steps with the help of puppet, but I wanted to try and configure a local test server. Here are my notes on the process!
Installing the Grafana server
I run this on a Centos 7 VM, with some of the usual development packages already installed (git, gcc, python, pip, …). Some steps will be distribution-specific, like grafana install here.
Follow Grafana install documentation, by creating the repository file /etc/yum.repos.d/grafana.repo with the following content:
[grafana]
name=grafana
baseurl=https://packages.grafana.com/oss/rpm
repo_gpgcheck=1
enabled=1
gpgcheck=1
gpgkey=https://packages.grafana.com/gpg.key
sslverify=1
sslcacert=/etc/pki/tls/certs/ca-bundle.crt
And then install the package
[root@grafana ~]# yum install grafana
Then start the server:
[root@grafana ~]# systemctl start grafana-server(optionally, run “systemctl enable grafana-server” if you want it to start at boot)
Install and configure grafyaml
Seeing the main dashboard? Good, now open the API keys menu, and generate a key with Admin role (required as we will change the data source).
Now install grafyaml via pip (some distributions have a package for it, but not Centos):
[root@grafana ~]# pip install grafyaml
Create the configuration file /etc/grafyaml/grafyaml.conf with the following content (use the API key you just generated):
[grafana]
url = http://localhost:3000
apikey = generated_admin_key
Configure a dashboard
Now get the current configuration for OpenStack dashboards, and add one of them:
[root@grafana ~]# git clone https://git.openstack.org/openstack-infra/project-config # or sync from your local copy
[root@grafana ~]# grafana-dashboard update project-config/grafana/datasource.yaml
[root@grafana ~]# grafana-dashboard update project-config/grafana/networking-sfc.yaml
The first update command will add the OpenStack graphite datasource, the second one adds the current networking-sfc dashboard (the one I wanted to update in this case).
If everything went fine, refresh the grafana page, you should be able to select the Networking SFC Failure rates dashboard and see the same graphs as on the main site.
Modifying the dashboard
But we did not set up this system just to mimick the existing dashboards, right? Now it’s time to add your modifications to the dashboard YAML file, and test them.
A small tip on metrics names: if you want to be sure “stats_counts.zuul.pipeline.check.job.gate-networking-sfc-python27-db-ubuntu-xenial.FAILURE” is a correct metric, http://graphite.openstack.org is your friend!
This is a web interface to the datasource, and allows you to look for metrics by exact name (Search), with some auto-completion help (Auto-completer), or browsing a full tree (Tree).
Now that you have your metrics, update the YAML file with new entries, then you can validate (the YAML structure only, for metrics names see previous paragraph) and update your grafana dashboard with:
[root@grafana ~]# grafana-dashboard validate project-config/grafana/networking-sfc.yaml
[root@grafana ~]# grafana-dashboard update project-config/grafana/networking-sfc.yaml
Refresh your browser and you can see how your modifications worked out!
Next steps
Remember that this is a simple local test setup (default account, api key with admin privileges, manual configuration, …). This can be used as a base guide for a real grafana/grafyaml server, but the next steps are left as an exercise for the reader!
In the meantime, I found it useful to be able to try and visualize my changes before sending the patch for review.